The Tennessee Department of Transportation (TDOT) list of projects issued at the end of 2015 totaled $6.1 billion. The updated project list included with the 2017 IMPROVE Act, on its surface, has a bottom line figure of $10.5 billion with the backlog potion being $4.7 billion.
A spreadsheet document dated 11/9/15 was issued on TDOT letterhead titled “Current Backlog,” defined in the secondary heading as “Projects Approved by the TN General Assembly and Currently Under Development.” The last line of the 13-page document states “Total Estimated Cost of Remaining Phases of Work” with a reported total of $6,095,023,692.
The 2015 backlog list included a total of 252 projects in 62 counties with Shelby and Blount counties having the highest number of projects at 25 and 10, respectively.
Contrasted to the projects in the IMPROVE Act listed in a report generated by TDOT dated 1/12/17, there are now 962 projects in all 95 counties at a cost of $10.5 billion.
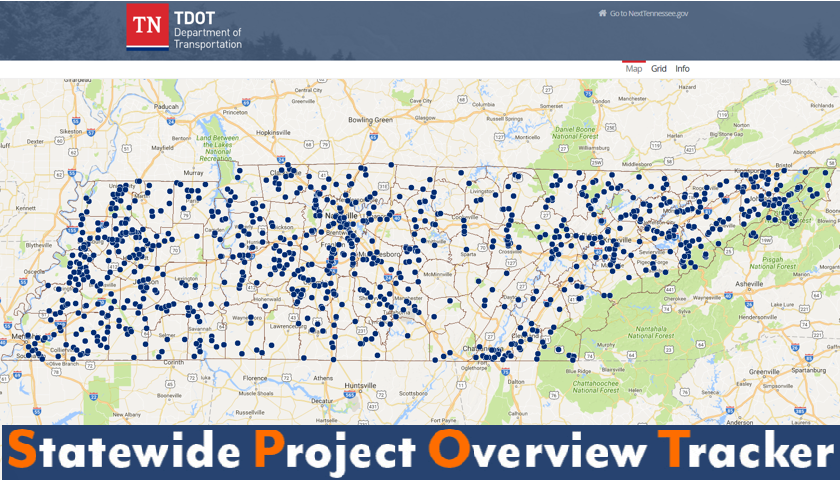
TDOT’s slick and interactive SPOT – Statewide Project Overview Tracker – displays the IMPROVE Act projects in map and grid form. Utilizing the “grid” feature of the “project needs” page, as it is named, facilitates sorting by “yes” or “no” on a project’s backlog status.
Projects TDOT has identified with a “yes” in the backlog column number 154 or 16 percent of the total 962 projects. The backlog projects, at a cost of $4.7 billion, represent 45 percent of the $10.5 billion.
The projects from the list generated in 2015 are categorized, clearly indicating the phase of the project, as follows:
Construction – 171 projects for $5 billion
Operations – 1 project for $700,000
Paving – 9 projects for $120 million
Right-of-Way – 63 projects for $697 million
Stage Construction – 6 projects for $227 million
Final Design – 1 project for $2.8 million
Utilities – 1 project for $5.5 million
TDOT’s latest list from January 2017, included in the IMPROVE Act – Improving Manufacturing, Public Roads and Opportunities for a Vibrant Economy – breaks down the projects in entirely new categories, an apparent reflection of what the project is expected to achieve, as listed below.
Interstate Modernization – 45 projects for $2.9 billion
Primary Trade Corridors – 46 projects for $2.1 billion
Rural Access – 90 projects for $2.3 billion
Safety – 19 projects for $137 million
Urban Economic Opportunity – 50 projects for $1.9 billion
Highway & Facility Maintenance – 171 projects for $702 million
Intelligent Transportation System – 15 projects for $46 million
Local Bridges – 526 projects for $392 million
The IMPROVE Act does not include any accountability measures to determine the success of the projects, such as quantifiable goals for the projects, requirements to analyze and report the results, or the use of the data to improve the outcomes of future projects.
The inconsistency in categorizing projects presents a challenge for the average taxpayer or the legislators approving the projects and their associated funding, to understand and compare the projects to those in the previous list of November 2015.
There are, however, some easily identified new categories and projects on the updated list for 2017.
As previously reported by The Tennessee Star, the “Intelligent Transportation System” category refers to the cameras and overhead LED signage, otherwise known as “distracted driver programs.”
The “Highway & Facility Maintenance” category lists 171 projects, the majority of which are actually “State Bridges” according to TDOT’s SPOT. The category also includes 9 non-bridge projects.
One of the non-bridge projects is to renovate the weigh station on I-65 in Robertson County at a cost of $14,500,000.
The other 8 non-bridge projects are the renovation of tourist Welcome Centers and Rest Areas, mainly along I-40, for a total cost of $28,250,000. Governor Haslam calls for Tourist Development, as a separate department, to receive $29 million in funding in his 2017-18 budget.


[…] previously reported in The Tennessee Star, TDOT’s report of the backlog in November 2015, just over a year prior to […]
Excellent article. I suggest that interested persons go to http://www.nashville.gov/Government/Boards-and-Committees/Committee-Information/ID/114/Metropolitan-Planning-Commission.aspx
Look at the staff report and the staff report attachment links. I was shocked to see the extensive plans and expenses for Nashville/Metro. I encourage everyone to to make a point of checking the agendas for the Planning Commission and some of the other commissions to see what is being proposed for your district also try to make it a point to check out Nashville.gov. Everyone should try to stay current on plans that impact their district and on the properties that are being rezoned from “residential” to “SP or SP-R”. These are “special purpose” zones that allow commercial use of properties. What I have learned is that once these proposals make it through the first meeting, they will almost inevitably be passed through City Council approval. This is very time consuming and frustrating, but there is a determined push to grow Nashville rapidly and this may be the only way to stay aware.